In our first round of audio quality testing (see previous article), Allion used precision test instruments to measure the sound quality of a high-quality PC motherboard. The primary goal was to compare the audio performance with different capacitor types. We used standard audio test criteria commonly applied to laptops, limited testing to the audible frequency range (20 Hz-20 KHz), and only tested the most common audio sampling rates (44K and 48k). However, the test results for the first round of testing were uninformative, since the audio quality measurements were nearly identical for both types of capacitors (solid and electrolytic).
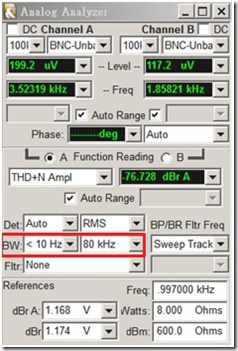
For our second round of audio quality testing, Allion used a digital audio source file with a sampling rate of 192 KHz. This source file could (theoretically) reach an audio frequency of 90 KHz, but the test instrument (Audio Precision SYS-2722) restricted us to an upper limit of 80 KHz. Since we were now focused on frequencies beyond the range of human hearing, we disregarded the 40 KHz AES-17 frequency limit. Based on this logic, we created a new sweep audio file that could reach an audio frequency of 80 KHz and set the bandwidth to 80 KHz. For this round of audio quality testing, we also focused on audio distortion and frequency response. We kept the original load test of 10 kW and 320 W. We also added a 32 W test, since this is the specification for most of earphones.
Figure 1:Relaxed bandwidth restrictions include ultra-high audio frequencies
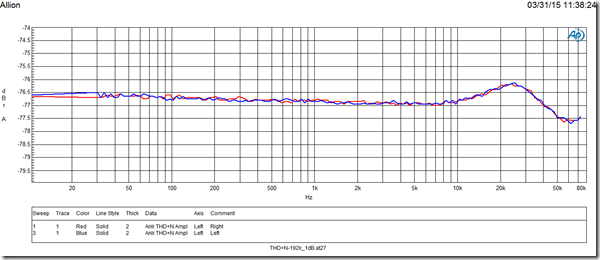
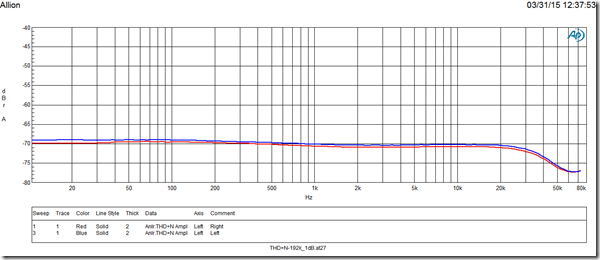
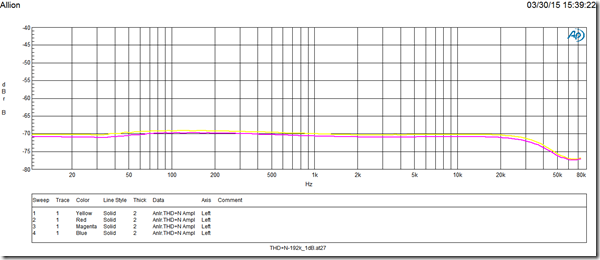
1. Total Harmonic Distortion Amplitude plus Noise vs 80K Frequency (THD+N performance in 80 KHz)
Electrolytic Capacitors
Solid Capacitors
Electrolytic Capacitors
Solid Capacitors
In the first set of test results above, where the loading was set to 10kW with an extended audio frequency range (up to 80 KHz), the overall distortion was concentrated in the 20-24 KHz frequency range. However, since the overall distortion was less than -75 dB, the performance was still great. For the second set of test results, where loading was set to just 32 W, the overall distortion was about -70 dB. This occurred because the 32 W loading lowered the input voltage. The other factor that influenced this distortion result is that the reference value was lower but the ambient noise remained the same. Using Microsoft’s loading test standards as a reference, a 20 Hz signal corresponds with -55 dB of distortion, while we measured distortion of only -70 dB, which is well below the -55 dB limit.
The results were also symmetrical for both types of capacitors, which points to similar audio performance in extended frequency ranges.
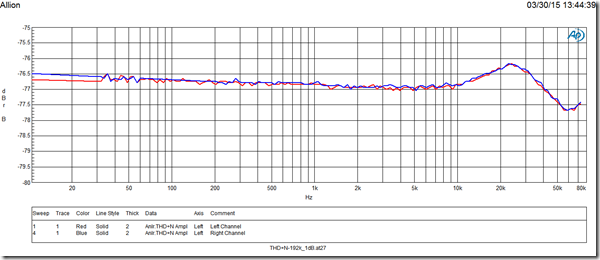
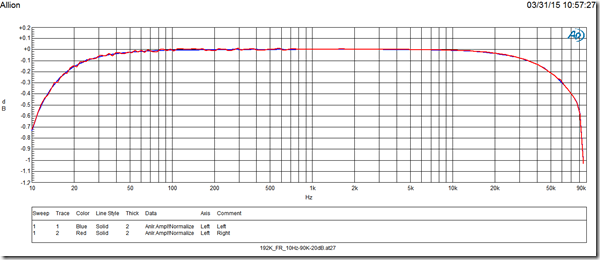
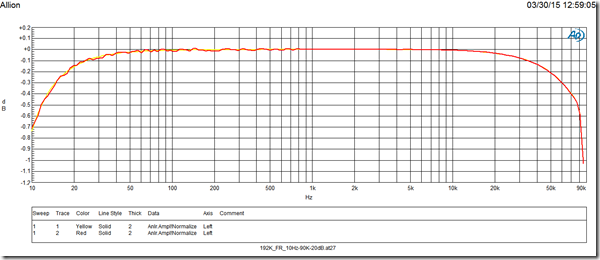
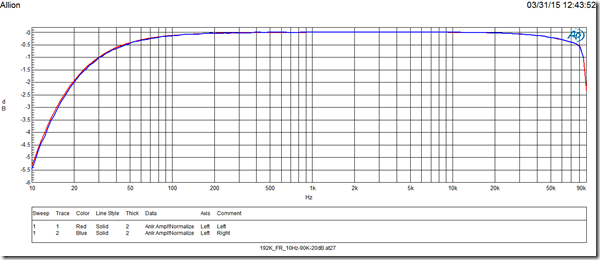
2. 80 KHz Frequency Response
Electrolytic Capacitors
Solid Capacitors
Electrolytic Capacitors
Solid Capacitors
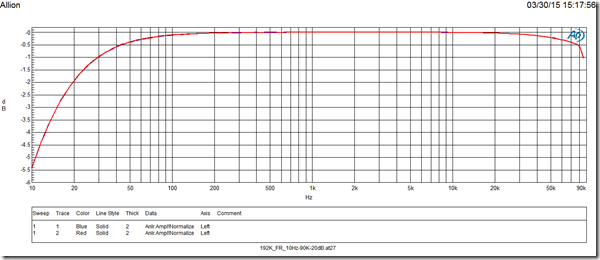
The 80 KHz Frequency Response test results above show that when the loading is set to 10 kW with an extended audio frequency range (up to 80 KHz), both high and low frequency attenuation cutoff areas were less than 1 dB. This means that with our ultra-high frequency audio source file there was very little frequency attenuation.
When the loading was set to 32 W, the low frequency attenuation was reduced more. However, using the 20 Hz standard of, the frequency attenuation cutoff was still less than 3 dB. Therefore, there was not much difference between these two capacitors.
Conclusion
In our testing thus far, the sound quality of the motherboard does not seem to be affected by the type of capacitor installed. In other words, electrolytic and solid capacitors perform equally well. In the first round of testing we confirmed this in the audible frequency ranges (20 Hz – 20 KHz) and in the second round of testing this was confirmed in ultra-high (<80 KHz) and ultra-low (< 20 Hz) frequencies as well.
Despite the equivocal test results from these first two rounds of testing, our test engineers were not finished yet. They still wanted to determine the critical factors for audio quality performance. As a result, they spent even more time studying the sound environment, audio components, and electronic signals. After this thorough review, they performed the third (and final) round of audio quality testing.
Our next article explores the test results for this final round of audio quality testing.
Capacitor Products – Audio Quality Analysis (III) – Standard Testing is coming soon!


