Thanks to the rapid adoption of mobile communication technology, smartphones are now central to our daily lives. At the same time, smartphone manufacturers are constantly seeking innovative ways to differentiate their products in a crowded global marketplace. As a result of this consumer demand and industry innovation, smartphone technology is constantly evolving with new and improved features, such as high-resolution cameras, enhanced touchscreens, and optimized audio. Since consumers are so much more discerning, smartphone vendors must not only upgrade hardware specifications; they must also focus on the user experience.
Most people interact with technology on a daily basis and experience it intuitively. However, simple intuition is not a reliable method for evaluating new products. At Allion, we use proven test methods to identify and resolve usability issues. These methods include comprehensive customized testing services from prototype to mass production, including quality assurance support, expert consulting, competitive analysis, and validation assistance. Since most smartphone vendors cannot compete on hardware alone, they must focus on improving the user experience with innovative applications and performance enhancements.
In this report, Allion applied two test methodologies: Competitive Analysis (CA) and User Experience (UX) to review and compare the performance of three smartphones.
- Competitive Analysis (CA) Reveal hidden strengths and weaknesses in your product design and positioning from an informed yet objective perspective.
- User Experience (UX) In consultation with the client, Allion evaluates products based on typical usage scenarios and then offers suggestions for improvement.
Smartphone (DUT) Specifications
Allion analyzed these three smartphones along three sensory dimensions that encompass the totality of the user experience: Visual, Auditory, and Tactile. The remainder of this article describes the user experience testing conducted in the four corresponding functional test categories: Display, Camera, Audio, and Touch.
Display Testing Analysis
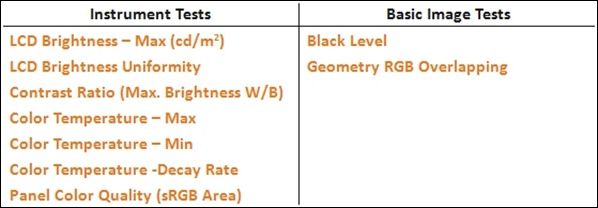
Display performance usually represents the first impression that users have with smartphones. In fact, display characteristics, such as screen brightness and color saturation, can impact the initial purchase decision and overall user experience. As a result, Allion used the following tests to evaluate smartphone display performance.
Display Testing – Test Item Matrix
Display Testing – Environment and Instruments
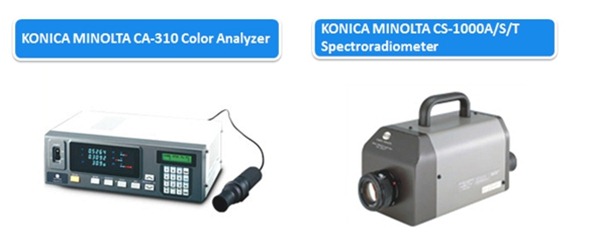
For this testing, we used a KONICA MINOLTA CA-310 Color Analyzer and a KONICA MINOLTA CS-1000A/S/T Spectroradiometer in our professional dark room.
Display Competitive Analysis (CA)
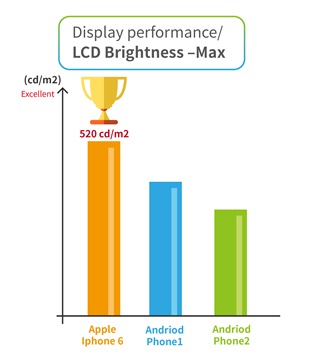
1. LCD Brightness- Max (cd/m2)
For this test item, higher values equate to brighter backlight displays. Smartphones with high backlight brightness show clearer images in direct sunlight. The test results showed that the iPhone 6 performed best with a max LCD Brightness of 520 cd/m2.
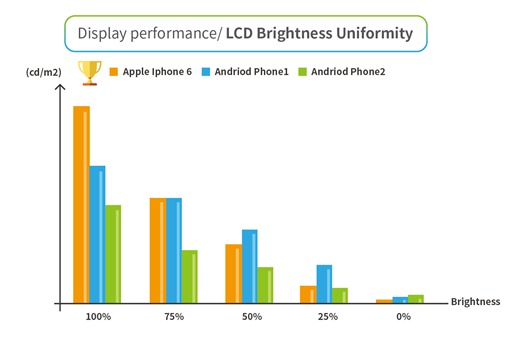
2. LCD Brightness Uniformity
For this test, we divided screen brightness into five reference points between zero and one hundred percent (0-100%) and then measured the value after adjusting the brightness. Smartphones with a greater range of brightness adjustment performed better. The iPhone 6 performed best on this metric, as indicated in the figure below.
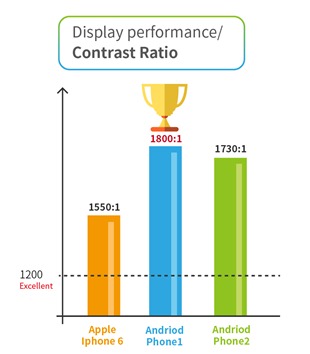
3. Contrast Ratio (Max. Brightness W/B)
This test item compared the contrast ratio (CR) between the maximum brightness in the white-based (W) diagram and the maximum brightness in the black-based (B) diagram. CR values above 1200 indicate acceptable contrast and these three smartphones all scored above this benchmark. However, the Android phones had much higher CR values (1800:1, 1730:1) compared with the iPhone 6 (1550:1).
4. Color Temperature –Max
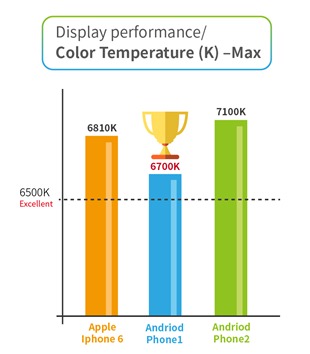
This test item measures the color temperature when the device display is adjusted to maximum brightness. When the color temperature is close to 6500K (daylight), it will have the best performance. If the color temperature is over 7000K, the display will be a cooler hue (bluish), which can cause eye fatigue for end users. If the color temperature is lower than 6000K, the display will be a warmer hue (yellowish). A yellowish screen affects the clarity of content on a white background. As a result, it is very important to control the color temperature. Our test result showed that the Android Phone 1 performed best, as it was closest to the optimal 6500K color. However, all three smartphones were above this benchmark, which means that end users will experience more eye fatigue than necessary.
5. Color Temperature –Min
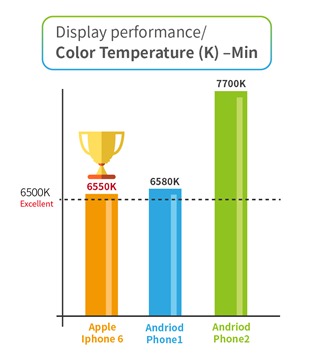
This test item measures the color temperature when the device display is adjusted to minimum brightness. The optimal color temperature is the same as the previous test, 6500K (daylight). As shown in the figure below, the iPhone 6 and Android Phone 1 were the closest to the optimal color temperature, while the Android Phone 2 exceeded the target value (6500K) by a wide margin, meaning that it appears more bluish than its competitors.
6. Color Temperature -Decay rate
In order to calculate Color Temperature Decay Rate, we used the following formula:
(Color Temperature Max – Color Temperature Min) / Color Temperature Max x 100%
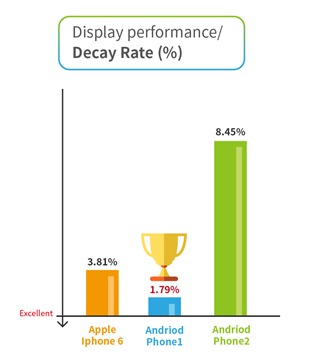
A good display backlight module will have a smaller decay rate. Looking at the figure below, we can see that the Android Phone 1 showed the best performance with the lowest decay rate (1.79%), closely followed by the iPhone 6 (3.81%).
7. Panel Color Quality (sRGB area)
For this test item, we used a standard sRGB color space area to measure RGB color coordinates. If the value is closer to sRGB 100%, this means that the color is more saturated. A saturated color display gives users brighter images. In the graphic below, the red triangle represents the ideal value (sRGB 100%) and the black triangle represents the measured values. As you can see, the iPhone 6 test results were closer to the ideal values indicating better display performance.
On the other hand, Allion used different image tests to conduct the Basic Image Tests. As the grayscale test image shown below, if the display cannot accurately reproduce the entire grayscale from bright to dark, it means the display lacks brightness control and therefore cannot reproduce true image brightness.
Summary
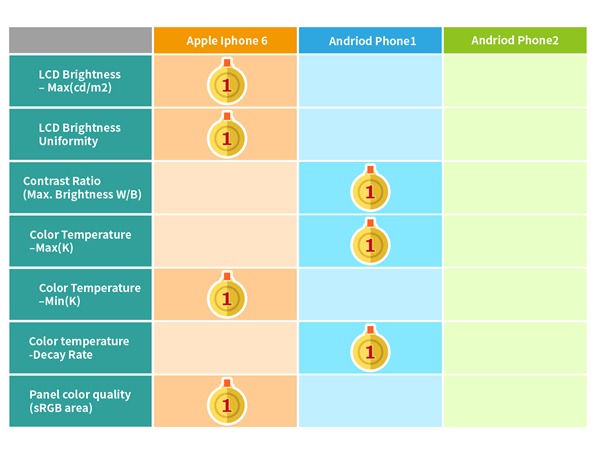
The table below summarizes the competitive analysis of these smartphone displays.
As you can see, the Apple iPhone 6 scored best in four out of the seven display tests, while the Android 1 came in a close second, with the best score in three of these tests. The Android 2 was a clear loser, as it did not excel in any of these display tests.
Display Performance User Experience (UX)
For Display Performance UX testing, Allion prepared a customized test plan based on typical usage scenarios. Since light intensity affects the clarity of the screen, we set each smartphone to auto-brightness mode and then tested them in bright and low light conditions. In bright light (15,000 Lux), the iPhone 6 performed best, while the Android 1 performed best in low light (100 Lux).
Products have their pros and cons, through competitive analysis and user experience testing, vendors can find new ways to enhance their products and improve customer satisfaction. Besides the display testing mentioned in this article, Allion provides other types of display testing, including viewing-angle testing, image-quality analysis, and skin tone checking.
Good display performance has a big impact on smartphone user experience. Another important factor is camera quality, which is the topic of the next article in this series.

