Photo taking is a popular smartphone activity, as reflected in the rise of the selfie and apps like Instagram, and as a result, camera performance is important to users. As technology advances, camera module specifications steadily improve. At this point, image resolution and feature sets are comparable to those found in consumer-grade digital cameras.
So, just how good are current smartphone camera modules? Are iPhones better at capturing images of the family pet? Do smartphones all perform poorly in low lighting conditions? These are the questions that an average person might ask.
This article is the second in a series focused on smartphone user experience testing. The first article in the series focused on display testing, whereas this one is focused on camera testing. For this testing, we applied the following test methodologies:
Competitive Analysis (CA): Reveal hidden strengths and weaknesses in your product design and positioning from an informed yet objective perspective.
User Experience (UX): In consultation with the client, Allion evaluates products based on typical usage scenarios and then offers suggestions for improvement.
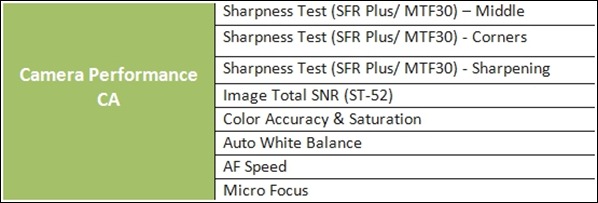
Camera Performance CA
1. Sharpness Test (SFR Plus/ MTF30) – Middle
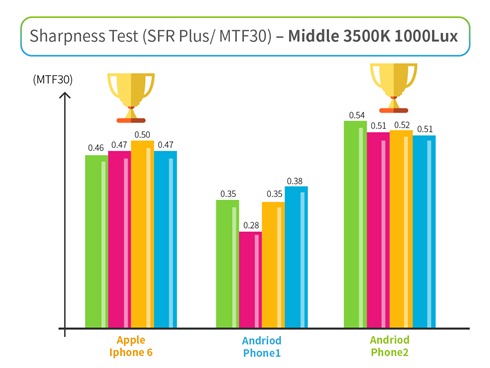
Allion used the SFR Plus Standard Chart to analyze optical data. We apply a MTF 30% (MTF30, Cy/Pixel) criteria to compare different lens resolutions and then analyze the MTF data in different image regions.Higher MTF values indicate higher pixel resolutions and clearer images. In Figure 1 below, the middle area stands for the four corners in the center of the SFR Plus Chart.
Figure 1: SFR Plus Standard Chart – MTF30 Middle
For this test, our engineers adjusted the ambient color temperature (2800K, 3500K, and 5000K) and brightness (1000 Lux, 100 Lux) in our professional darkroom. To give you a sense of these numbers, the ambient color temperature for the light fixture of a typical department store is 3500K and 1000 Lux of brightness. For Skype cameras, the specified color temperature is also 3500K.
The graphic below shows that the Apple iPhone 6 and Android Phone 2 have much better sharpness than the Android Phone 1 with 3500K/1000 Lux ambient lighting.
2. Sharpness Test (SFR Plus/ MTF30) – Corners
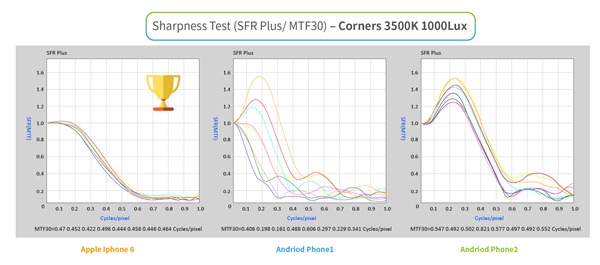
For the next test, we also used the SFR Plus Standard Chart to analyze optical data. Allion observed the MTF30 data from the eight corners of the chart below (Figure 2).
Figure 2: SFR Plus Standard Chart – MTF30 Corners
If the MTF30 values are close, this means that the image resolution in the corners is better. Higher MTF values indicate higher pixel resolutions and clearer images.
With 3500K/1000 Lux of ambient lighting, iPhone 6 had the better lens, since the values at the corners were very close. In the graphs below, iPhone 6 has tight and smooth curves. However, the two Android Phones both have less-refined curves, which mean that their lenses perform poorly at the corners.
3. Sharpness Test (SFR Plus/ MTF30) – Sharpening
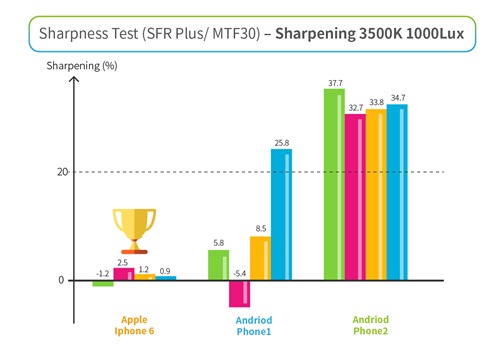
For this third test, we used the SFR Plus Standard Chart to analyze sharpness data from the four corners in the middle area. Clearer images usually have higher sharpness, but this leads to rough screen edges.The solution is to control the sharpness in a certain range, so that users do not see any rough edges.
In this case, we used the Skype Specification as our image sharpness criteria, such that, if the value is over 20, the image is considered too sharp. With 3500K/1000 Lux of ambient lighting, both Android smartphones had sharpness values over 20, while all of the sharpness values for the iPhone 6 remained close to zero.
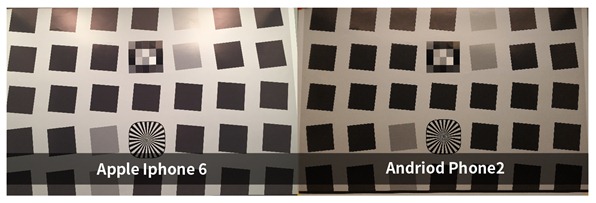
By observing the images below, you can see that the Android Phone 2 (right image) has rough edges, while the iPhone 6 (left image) has smoother edges.
Figure 3: SFR Plus Standard Chart – MTF30 Sharpening
4. Image Total SNR (ST-52)
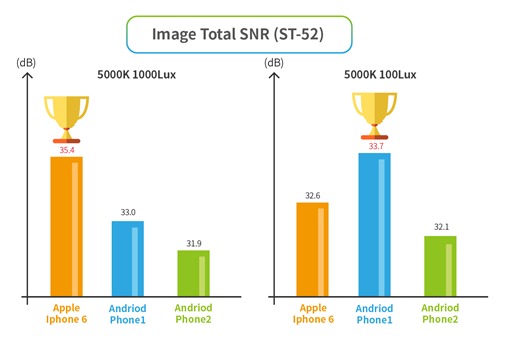
For this test, we used a ST-52 Standard Chart to analyze the Signal to Noise Ratio (SNR) in different zones. If Total SNR (dB) values are larger, photo quality is better. Our teams used smartphones to shoot the 12 zones in the chart shown below and then analyzed the results.
Figure 4: ST-52 Standard Chart
This test is conducted with 5000K light (equivalent to soft sunlight) and it is a specific color temperature environment recognized by Skype. Photos are less likely to have white balance shift with 5000K light, which is good for SNR testing.
With 5000K/1000 Lux of ambient lighting, the iPhone 6 had the best results for SNR. However, with 5000K/100 Lux, the Android Phone 1 had the best SNR. In this case, we think that firmware was the main factor influencing SNR.
5. Color Accuracy & Saturation
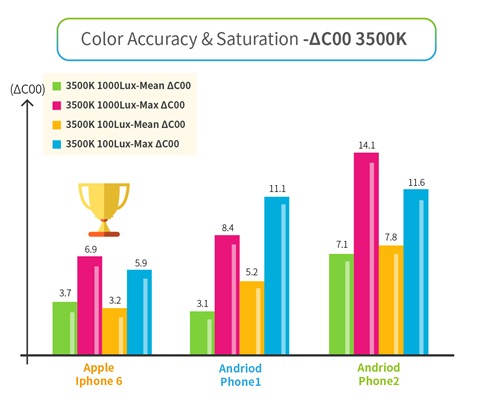
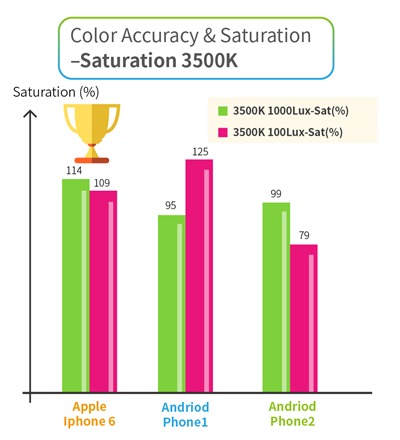
For this test, we used a Macbeth standard chart to analyze each smartphone. The Macbeth 24 patch color checker is used to analyze color performance. The test environment was first adjusted to match specific color temperatures and brightness. We then compared the mean average value of chromatic aberrations (Mean ΔC), Max chromatic aberrations (Max ΔC), and Saturation (%).
- When Mean ΔC and Max ΔC values are small, there is less chromatic aberration
- When saturation values are high, the image shows high color saturation
Figure 5: Color Accuracy Analysis Result – Macbeth 24 patch color checker
In our color accuracy testing, the iPhone 6 had the smallest chromatic aberration, under both 100 Lux and 1000 Lux of 3500K ambient lighting, as shown in this figure.
The iPhone 6 also displayed the best color saturation.
6. Auto White Balance
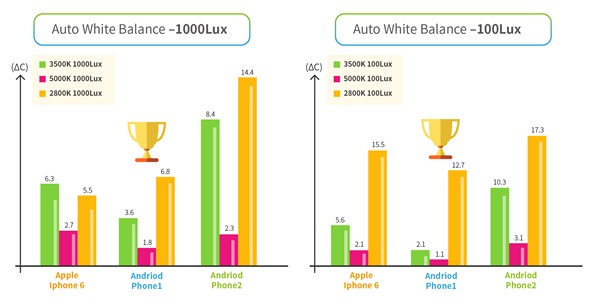
For this test, we used the Macbeth Standard Chart to analyze chromatic aberration (ΔC) values. We also used imaging software to analyze the ΔC values in the grayscale and then display these ΔC values at each scale.
- Smaller chromatic aberrations equate to better AWB performance
As indicated in the figure below, Android Phone 1 had consistently better AWB performance with both 100 Lux and 1000 Lux of brightness and under 3 colors of ambient light (2800K, 3500K, and 5000K).
7. AF Speed
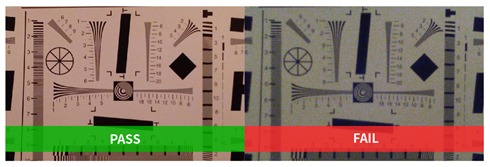
For the AF Speed test, shorter time means faster AF Speed and better performance.
Figure 6: AF speed testing pass/fail results.
We set up two different test environments for AF speed testing.
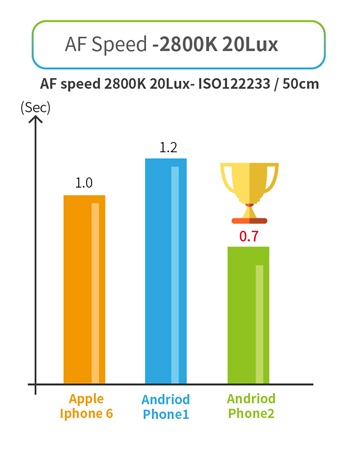
First, we used 2800K/20 Lux lighting, which is similar to an indoor tungsten lamp environment. Under these test conditions, the Android Phone 2 performed best with an AF speed of 0.7 seconds, as shown in the graphic below.
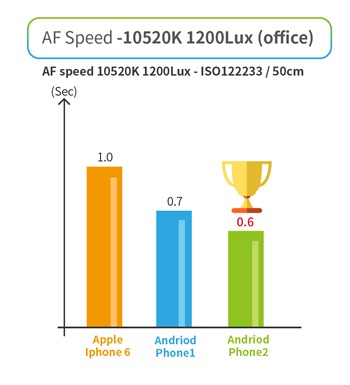
Second, we used 10520K/1200 Lux lighting, which is similar to an office environment. Under these test conditions, the Android Phone 2 again came out on top again with an AF speed of just 0.6 seconds.
In the end, the Android Phone 2 won both rounds of the AF speed competition.
8. Micro Focus
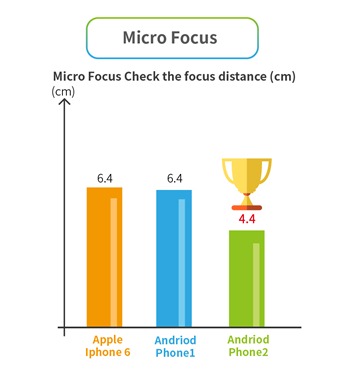
For micro focus testing, if the camera can maintain focus over short distances, it shows better performance. In the graphic below, you can see that the Android Phone 2 can focus correctly at focal distances of 4.4 cm, 2 cm less than the competition. This means that the Android Phone 2 has significantly better micro focus capabilities than the other two smartphones.
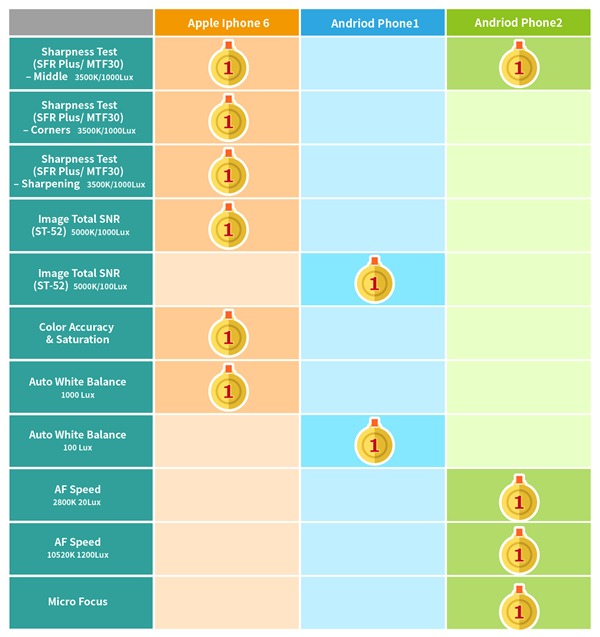
The Competitive Analysis results are summarized in the table below. The iPhone 6 came in first place six times, as many wins as the other two smartphones combined.
UX Experience
For our UX experience testing, Allion first shot photos in different scenarios, such as sunlight, night view, plant, sunset, food, indoor, outdoor, etc. We then asked several typical users to compare the photos taken with the different smartphone cameras.
For example, in the 2800K/1000 Lux test environment, we found that the iPhone 6 captured images closer to reality due to its superior AWB performance.
However, in the 5000K/1000 Lux testing environment, the Android Phone 2 images were more lifelike and the Android Phone 1 images brighter.
Every smartphone company has their own standard for AWB and sharpness. Therefore, Allion can customize our UX testing based on customer demand. Allion can also perform scenario testing, such as HDR, flashlight, selfie, beauty enhancement mode, and panorama mode.
Camera modules are certainly important smartphone components. Many companies use image quality for major marketing investments and many people use their smartphone multimedia apps to watch video or play music. Due to this reality, we strongly suggest that you perform camera testing prior to market launch.
Since audio playback is another important smartphone feature, our next article focuses on our recent smartphone audio testing.
Related Articles:

