Most smartphones include touch interfaces so that users can use simple gestures, like dragging, scrolling, sliding, or swiping to interact with their phone. Although touch technology is not new, some touch screens still perform poorly. In the ultra-competitive smartphone market, delivering a quality user experience is the key to success.
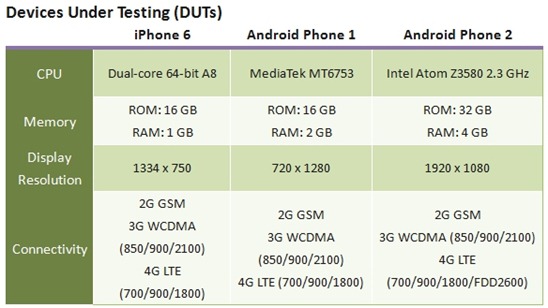
In this article, we explore some important factors that contribute to smartphone touch screen quality. To understand these factors, we present some recent testing that our smartphone validation team performed. These tests evaluated touch screen sensitivity, interference capability, scroll/drag performance, etc. To help the reader understand the test details, we have provided visual aids and summary tables below.
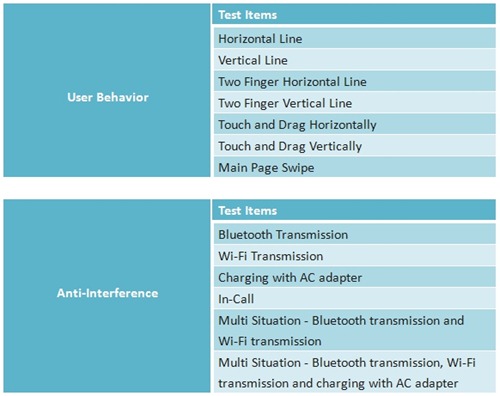
We divided our touch tests into two categories:
• User Behavior such as scroll, multi-touch, and drag.
• Anti-Interference to evaluate possible touch screen interference due to various wireless transmission (Wi-Fi/BT) and power charging conditions.
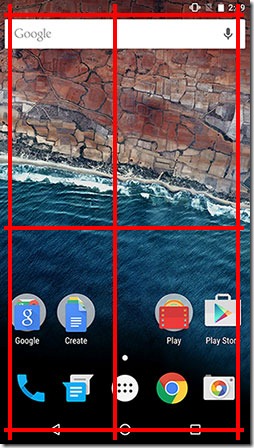
We tested touch screen quality along the six red lines and within the four zones shown in the figure below.
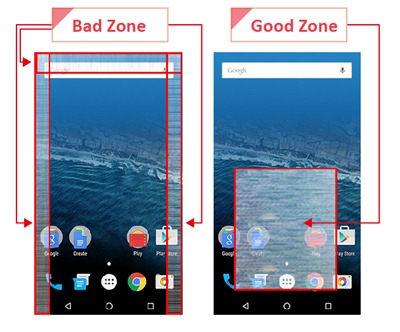
First, we used data provided by touch testing apps to calculate the average gap and maximum gap. Generally speaking, smaller gaps between pixels is better. We used these gap values to analyze sensitive areas (good zones) and non-sensitive areas (bad zones).
Here is an example. First, we collected the average gap values and then used our test instrument to draw six red lines on the screen. After locating the line positions, we used the difference between the original lines and the red lines to calculate the average and maximum gap values. The table below shows some sample data which we used to locate the good and bad zones.
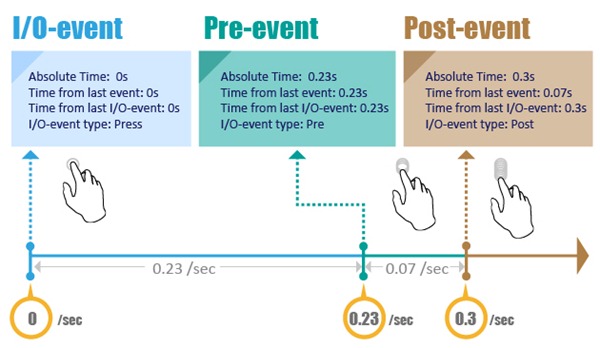
We tested touch reaction speed with an ultra-high-speed camera in three stages:
1. I/O Event: Screen touched
2. Pre-Event: Start dragging
3. Post-Event: Line displays
For example, first we touched the touch panel. Next, we started to draw the vertical line at 0.23 sec. Finally, we saw the line at 0.3 sec. This is shown in the figure below.
With the same logic and testing methods, we continued our user behavior testing.
1. Horizontal Line
The iPhone had the best performance in the horizontal line testing, as it only took 0.1 seconds to display the horizontal line. The Android Phone 1 needed 0.3 seconds, which was the worst performance. These test results are shown in the figure below.
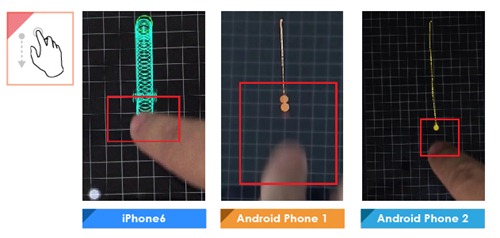
2. Vertical Line
The iPhone 6 had the best performance (once again) in the vertical line tests, while the Android Phone 2 delivered the worst performance, as shown in the figure below.
With vertical line touch testing, we found that the iPhone 6 had the smoothest lines and the smallest gaps. The iPhone 6 lines were very close to the actual lines traced with a finger. In comparison, both Android phones showed obvious gaps in the lines.
3. Two Fingers Horizontal Line
Due to the development of multi-touch technology, many users will use two finger gestures. Using ultra-high-speed camera video, we found that the iPhone 6 had the faster response time (0.1 sec) compared with the other DUTs. For instance, the Android Phone 1 took more than three times as long to respond (0.33 sec).
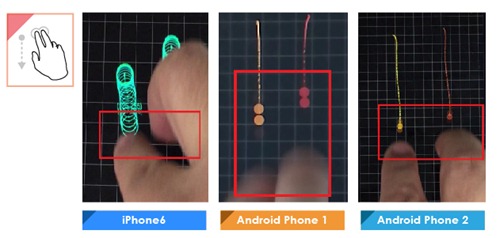
4. Two Fingers Vertical Line
In this test, the iPhone 6 performed best, while the Android Phone 1 was the worst.
As with the single-finger testing, the iPhone 6 had more consistent lines than the Android smartphones, which showed obvious gaps between lines and fingers.
5. Touch and Drag Horizontally
Once again, the iPhone 6 performed best on this test. The Android Phone 2 response time was 0.35 seconds, which was the worst performance among the three DUTs.
6. Touch and Drag Vertically
Surprisingly, the iPhone 6 performed worst on this test, mostly due to poor sensitivity on the touch screen edges. The Android DUTs performed much better.
7. Main Page Swipe
Since users spend most of their time on the main page, page switch speed and response times are important user experience factors. Although the iPhone 6 took 0.5 sec to switch pages completely, users felt the page switch only took 0.05 sec. Hence, users feel the iPhone 6 has the quickest response time. According to our test results, the Android Phone 1 had the fastest main page swipe time, but it took users 0.14 sec to detect the page switch. As a result, the iPhone 6 had better user experience than Android Phone 1.
Anti-Interference Testing
Allion used the following six scenarios to evaluate smartphone anti-interference:
• Bluetooth® Transmission
• Wi-Fi Transmission
• In-Call
• Bluetooth® Transmission + Wi-Fi Transmission
• Bluetooth® Transmission + Wi-Fi Transmission + AC Charging
First, we drew a line from the top left to the bottom left of the touch screen over a period of 3 seconds. Next, we used touch testing apps to examine the route differences. For example, the blue line below represents the original traced line without any interference, while the red line represents the results from the touch testing apps. We analyzed the maximum gap and pixel shift based on these two lines.
Pixel shift will affect the accuracy of the touch panel. For example, during an in-call situation, users might not be able to tap the correct spot while editing a photo or playing a game.
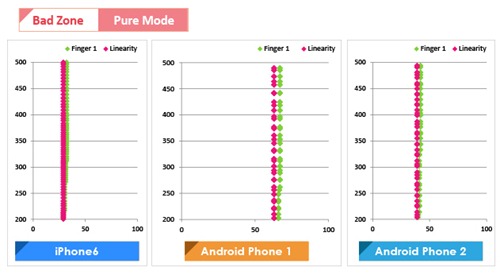
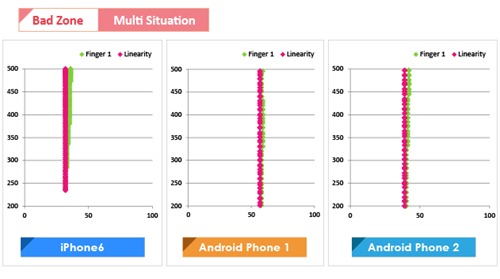
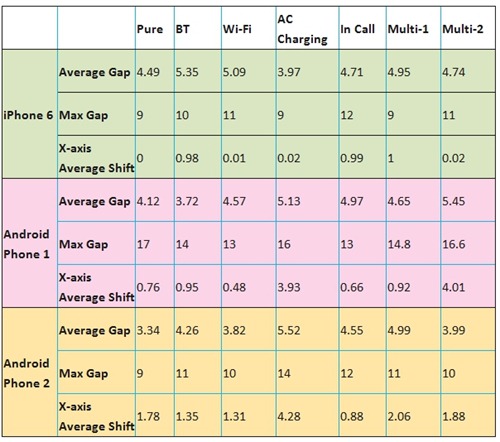
Taking the bad zone as an example, the following table shows our measurements.
We also collected measurements with wireless interference (Wi-Fi and Bluetooth®) and AC charging. It was clear to see the shift and the maximum gap for each DUT.
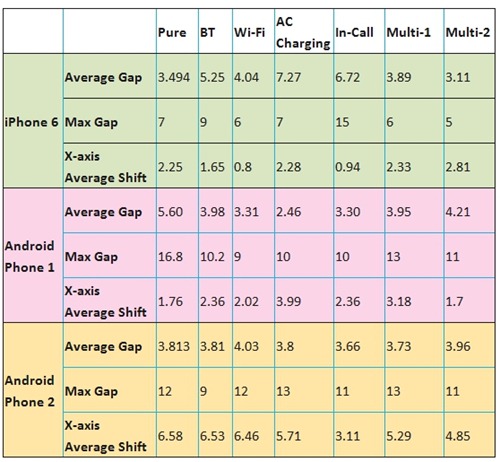
We summarized all this data in the table below. As you can see, the gaps and shifts increased with added interference. However, users would not detect any obvious differences between these smartphones, since they all use high-resolution touch display panels.
Android Phone 1 delivered good performance in the bad zone touch testing. It did not show any big shifts in any scenario. Furthermore, its maximum gaps were smaller than the original data. When the iPhone 6 was in-call, its maximum gap increased significantly, but the overall shifting was average. The Android Phone 2 did not have much difference on gaps, but in-call its shifting changed more than the other DUTs.
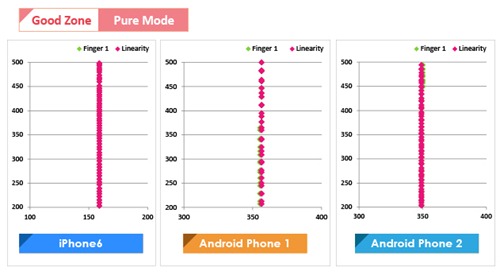
Now, we move to the good zone touch test results. We collected base data first.
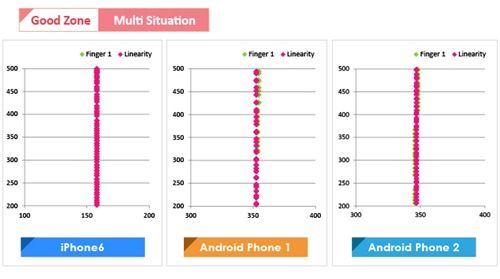
The test results with added interference are shown in the table below.
The table below shows that the iPhone 6 had excellent performance with different interference conditions in the good zone. The Android smartphones also performed well. The after-interference test results were similar to the original data. Overall, these three DUTs showed good anti-interference capability in the good zone.
Allion can also conduct other test scenarios. For example, voice calls may influence touch quality due to the difference between 3G/4G & GSM/GPRS signal transmission. Other internal inference sources, such as vibrator, speaker, and receiver, are all potential factors that may affect smartphone touch quality.
As for data transmission, sometimes different RF bands (700/900/1800) can affect touch performance. This type of data transmission testing collects more data than simple voice call testing. Since the frequency range is broader, the effects and gaps are also larger. There are many other test combinations for touch testing. Allion often customizes these test plans to meet the unique needs of our clients.
To learn more about our broad range of product validation and verification services, please visit our website at www.allion.com. All of our previous smartphone user experience testing articles are also listed below for your reference.
Related Articles:
Smartphone User Experience Analysis – Display
Smartphone User Experience Analysis – Camera
Smartphone User Experience Analysis – Audio (I)
Smartphone User Experience Analysis – Audio (II)


